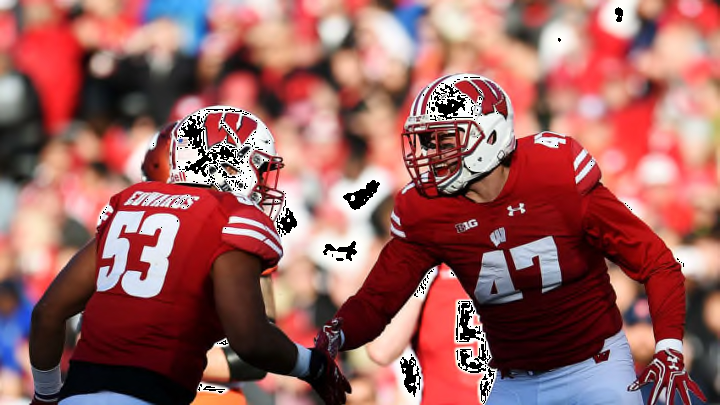
There are two weeks left until Wisconsin Badger football kicks off the 2017 season. So what do productivity numbers foretell for Big Ten football?
Forecasting college football is an inexact science. But you already knew that. There are of course different means of evaluation and projection including productivity.
Of course you look at the top teams from the final rankings. Returning starters and the coaching staff is also helpful. So is the strength of the incoming recruiting class.
On Friday, Big Ten Network tweeted out an interesting statistical compilation looking at productivity numbers.
https://twitter.com/BTNLive/status/898658427517288448
I asked @BTNLive its source material for the graphic. They pointed me to an SB Nation article from January which had this breakdown. The article explained the methodology for measuring “production.” Special emphasis was given for defensive backs.
"The main takeaways are similar to last year: disruption and continuity in the secondary are key. And the ability to get hands on passes, via interception or breakup, is harder to replicate than any other, when it comes to box-score disruption."
The article looked at a mix of passes defensed, tackles (for loss), and sacks by position groups. All part of the productivity
I don’t disagree with the general premise here. Returning productivity is a unique way of assessing teams’ returning strength.
Next: Nigel Hayes Signs Partially Guaranteed Deal with NYK
However, it’s an incomplete to even misleading metric and here’s why. Bad defenses are going to compile more of those statistics because they’re on the field more. They’re going to allow more first downs and yards. Playing more snaps means more opportunity to gain tackles and sacks.
For example, Maryland and Northwestern each return 77 percent of its production. But both schools struggled in third down defense in 2016 in the Big Ten. Maryland ranked 8th (37.5 percent) and Northwestern 6th (36.6 percent). Wisconsin was 2nd in the Big Ten allowing just 27.9 percent conversions.
In addition, Wisconsin was 3rd in the Big Ten last season allowing an average of 16.4 first downs per game. Meanwhile, Northwestern was 3rd worst in the Big Ten allowing 21.5 first downs per game on average. Maryland was the worst in the conference allowing 23 first downs per game.
Indiana has an incredible 96 percent of its production returning on defense. Yet the Hoosiers had the 9th best scoring defense in the Big Ten last year. Wisconsin had the 3rd best scoring defense in the conference in 2016.
Next: What to Expect D'Cota Dixon Edition
I understand the allure of production stats. But volume is not indicative of quality. Just ask my family and friends. I make a lot of jokes, but making a lot of them doesn’t mean I’m funny. Mediocre to bad defenses can still fill the stat sheet. They have more plays and more time on the field. The production measure effectively punishes teams that get 3-and-outs.
Teams with bad offenses also put their defense on the field more. Again, that means the defense is compiling stats. So worry not Wisconsin fans. Production numbers alone does not a defense make.
